The Basics of Financial Statement Analysis:
From a Credit Professional’s Perspective
By: Charles Edwards, CCE | Vivian Hoang, CCE | Brendon Misik, CCE | Kenny Wine, CCE | John Zummo, CCE
Introduction: Balancing Act
This is a condensed guide to assist credit professionals that are new to requesting and analyzing financial statements or those that are coming to credit from various other departments (accounts receivable, accounts payable, clerical, sales, etc…) and don't have as much (or any) experience working with financial statements. More experienced credit professionals may also be able to utilize the information contained in this guide to enhance and sharpen their financial statement analysis skills. Many companies do not require financial statements and many more didn't require them prior to 2008; however, the number of companies that have added the collection and analysis of financials to their credit file reviews have grown significantly, especially after the recent economic downturn. Many of these companies have now included the collection of financials into their corporate credit policies. It is now more important than ever to not only collect financials, but also be able to analyze them properly and be able to explain your analysis as part of your credit decision. For that reason, it is very important to have at least a basic working knowledge of financial statement analysis and understanding of the key ratios and ideas that go into a sound credit decision. This is what this guide hopes to achieve for the new entrant into credit management.
This guide will walk through the basic ratios to analyze leverage, liquidity, efficiency, profitability, and debt coverage of a company. There will also be an overview on the four basic financial statements (balance sheet, income statement, statement of shareholders’ equity, and statement of cash flows). In addition, the quality differences in financial statements that a credit professional would receive will also be discussed. These will include internally prepared (using QuickBooks or other software), tax returns, compiled, reviewed, audited with a qualified opinion, and audited with an unqualified opinion. The basic financial ratios will show a comparison of two fictitious companies, ABC Corporation and XYZ Corporation. ABC Corp. will be an example of a financially strong company, while the financial statements of XYZ Corp. will be an example of relatively weak financials. The purpose for this would be to allow you, the reader, to follow along with the authors to show performance, and some compare and contrast narrative on what to look for (financially) between these two types of business entities from a credit perspective. Each section will have some “core” financial statement analysis credit metrics, how the calculations are completed, some caveats to watch out for, and “what they mean” from a credit management perspective.
Additional information will be provided on where the reader could go for more subject information to further fine-tune their financial analysis skill set. There will be a short explanation on NACM's credit class offerings followed by a short description of the various NACM-credit designations as well as some suggested financial websites to check out for additional information. We end this paper with a glossary of financial terms and ratios for easy reference, and an appendix with complete financial statement exhibits on both ABC Corp. and XYZ Corp.
Overview of Financial Statement Types
Before even beginning the process of analyzing a financial statement, it is important to understand the different types of financial statements, how they are prepared, and how reliable the information contained in them may be. The cover letter of a financial statement should tell you how the financial statement was prepared; depending on the type, we are able to better understand to what level the information was vetted for our reliance on the information provided. The types of financial statements that you are likely to see, in order of least costly and least reliable, are: internal, compiled, reviewed, and audited financial statements. Below is a more thorough explanation of these types of statements.
Internal financial statements are prepared by members of the business without the support or assurance of any outside sources, such as a CPA firm. These types of statements may also be referred to as management prepared or “in-house” financial statements. Internal financial statements would likely not come with a cover letter or notes. This type of financial information is often generated from in-house accounting software such as Quick-Books or Sage, and is only as reliable as the information being entered by the user. For many smaller companies, this may be the only type of financial statement available. Other types of financials include a cost/fee paid to the preparer and may not be pursued if it has not been specifically requested by a lender or investor. There is no assurance that information generated on internal financial statements is accurate. That is not to say this information cannot be useful, but it would require an assessment of the character and expertise of the source in order to better assess how reliable information delivered in this format may be.
Compiled financial statements will involve the assistance of an accounting professional or CPA, but their services are merely to verify that the data is presented in a format consistent with professionally prepared financial statements. The costs are much less than a review or audit, as there will have been little, if any, attempts to verify the underlying financial information. As such, the reliability of the information would rest heavily on the character and expertise of the individual and business producing the information in much the same way as with an in-house financial statement.
Reviewed financial statements are becoming more and more common with small to mid-sized companies in the U.S. A financial statement review is not as thorough or reliable as an audit, but the cost for a review would be less, and thus a review may be more appealing to the entity covering the cost of preparing the financial statements than would a more costly audit. Reviewed financial statements are prepared by a certified public accountant (CPA) and an effort is made to verify much of the information. The scope of a review will vary by firm or circumstance. A thorough review may include many of the same verification activities that would exist in an audit. A review would likely include ratio analysis, investigations of inconsistencies of major journal entries, a review of records, follow up questions from previous reviews, and a review of accounting & other business practices. A review would not require the accountant to gain any significant assurance of internal controls, assess fraud risk, or other types of audit procedures. A review would also not require a CPA firm to express an opinion on the validity of the financial statements, which removes the firm from any accountability in the event of fraud or miss-represented information.
Audited financial statements are the most reliable form of financial statements. An audited financial statement would require the CPA firm preparing the statement to express an opinion on the reliability of the information contained in the statements. There are three types of opinions that may be expressed: unqualified opinion, qualified opinion, and an adverse opinion.
- In an unqualified opinion, the firm conducting the audit represents that the information is presented fairly, in all material respects, and correctly represents the financial position of the business being audited. This is the language you want to see in the cover letter of your audited financial statements.
- A qualified opinion will have identified a specific area in which the firm conducting the audit was not able to confirm that the information expressed was in compliance with either company policies and controls, or the accounting policies governing the audit. This may not mean the information is inaccurate or cannot be relied upon, but you should seek to understand the circumstances and details of a qualified opinion to determine if the qualification would significantly alter the assessment of the financial information and your credit analysis. The terms “except” or “subject to” used in the cover letter after the auditing firm represents that the information is presented fairly, are generally reference points as to why the opinion is qualified.
- An adverse opinion would mean that information was not able to be verified and may indicate fraud or other issues. This could also represent that the accountant or firm conducting the audit was not able to verify that the subject of the audit has the financial wherewithal to be considered a going concern and continue to operate its business. An adverse opinion is rare, and any reliance on financial information carrying an adverse opinion may not be advisable. A credit professional should discuss this opinion with the auditing firm as well as with the customer in order to gather further information before deciding on the next steps to take in their credit analysis and decision.
Tax returns are another format in which you may see financial information provided from a prospective or active customer. It is important to understand that the rules, laws, and formats governing tax returns are different than those governing an audited financial statement produced for investors and creditors. It is difficult to define the general reliability of a tax return, as they are produced in a variety of ways depending on the return. Tax returns may be prepared by an individual and may pose many of the same reliability concerns that you’d expect from an internal financial statement. There is, however, some additional level of assurance knowing that a tax return is subject to an audit by the IRS, so presenting inaccurate information may come with the risk of perpetrating tax fraud. Tax returns may even be prepared by a licensed CPA and come with much of the same levels of assurance that we’d expect from reviewed financial statements.
Four Basic Financial Statements
Once you know what type of financial statements you are dealing with, you will now have to go through these different statements to begin your analysis. There are four basic financial statements that are commonly prepared by profit-making organizations: balance sheet, income statement, statement of shareholders’ equity, and statement of cash flows. These statements should all be prepared in accordance with GAAP (Generally Accepted Accounting Principles); however, GAAP is not a law and is only required by publicly traded companies. These financial statements, when combined, give the reader a good idea of the financial strength and condition of a company. Between these four financial statements, the reader can see where the cash and other assets of a company are now, where they came from, and where they went. If prepared properly, these statements should assist with a credit professional’s ability to make a sound credit decision. An overview of these four financial statements is provided below.
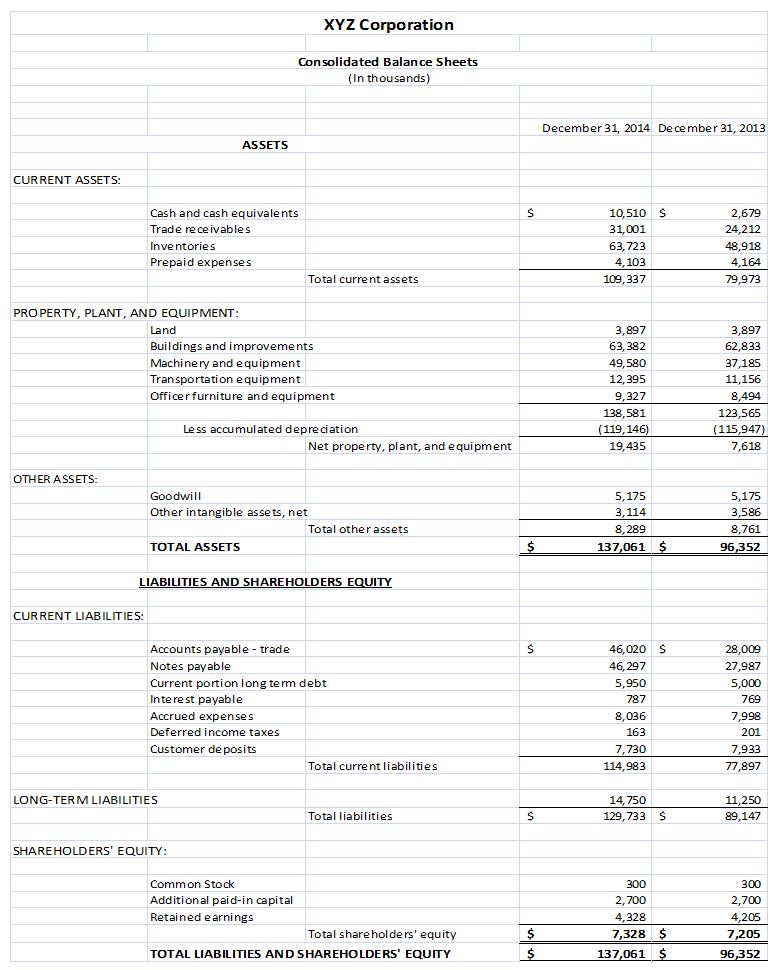
Balance Sheet: The balance sheet shows the value (according to GAAP) of the assets of a company at a particular point in time and how these assets were funded. Assets can be funded with either debt (liabilities) or equity. This creates the basic accounting equation of assets (A) = liabilities (L) + shareholders’ equity (E). Assets are generally listed based on how quickly they can be converted into cash. Liabilities are generally listed based on their due dates. Certain ratios that will be discussed in this guide will allow the reader to understand the leverage and liquidity of a company’s balance sheet in order to determine the company’s ability to meet short and long term financial obligations. Understanding the balance sheet can also give the reader an idea of the company’s ability to raise funds in the form of debt or equity in order to buy additional assets or to pay back other debt obligations.
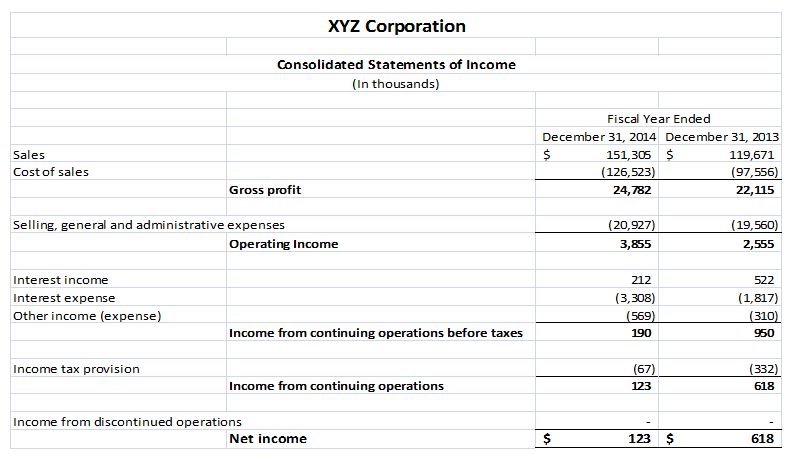
Income Statement: The income statement shows the revenues and expenses that a company generates over a particular period (i.e. month, quarter, year, or year-to-date). These line items are generally calculated using the accrual accounting method that conforms to GAAP. Accrual accounting follows a matching principle and records transactions at the point of sale. Basically, accrual accounting calculates the receipts instead of the actual cash. In accrual accounting, the transaction is made at the time of the sale, even if it was sold on a credit account and the cash isn’t collected for a few weeks or months. The other method of accounting is the cash basis. This method is used less frequently and only calculates transactions (revenues and expenses) when cash actually exchanges hands.
The top line of the income statement is the revenues (or sales) generated from the sale of goods and/or services under normal operations. The next line is generally the direct costs involved in making those sales. The net figure of these two gives the gross profits and gross margins, which will be discussed later when we get into profitability ratios. Other operating expenses such as selling, general, and administrative expenses are then deducted from gross profits to get to operating income, which will again be discussed in more detail later. Depreciation and amortization expenses are also deducted. These expenses are non-cash expenses used to spread out the cost of large and long-term assets over the periods they are used. After other non-operating income and all expenses, including taxes, have been taken into account, the bottom line shows the net income (or loss) of a company. Again, the net income (or loss) is not necessarily the cash that a company generated, but the difference between the sales receipts and the expense receipts for a particular period of time.
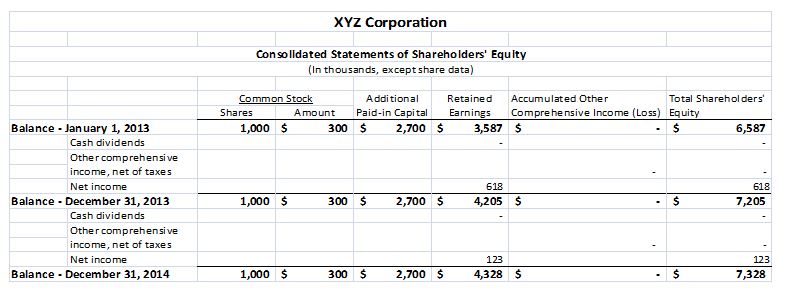
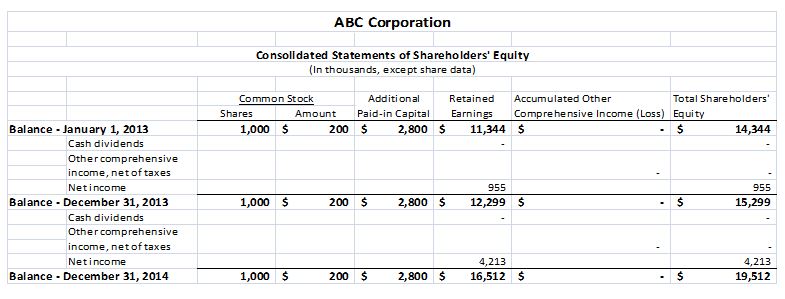
Statement of Shareholders’ Equity: This statement ties both the balance sheet and the income statement together. The statement of shareholders’ equity starts with the net income (or loss) from the income statement. From there, distributions/dividends or capital injections can be made to reconcile to the equity section of the balance sheet. The amount of net income left over after distributions/dividends is retained in the business and increases the retained earnings account in the equity section on the balance sheet. All of the changes in the equity section of the balance sheet are detailed in the statement of shareholders’ equity. Other equity sales and purchases, such as stock repurchases, are also detailed on the statement of shareholders’ equity and reconcile to the other equity accounts on the balance sheet. Many non-publically traded companies have simple equity accounts and do not create or provide a statement of shareholders’ equity. Typically, the difference in retained earnings from one period to the next is equal to the net income of the company. If the amount is less, than the difference is typically the amount of distributions/dividends that were taken; however, this should be verified with the company for accuracy. The dates on the current balance sheet and the prior period balance sheet should match up to the date range of the income statement in order for these calculations to work.
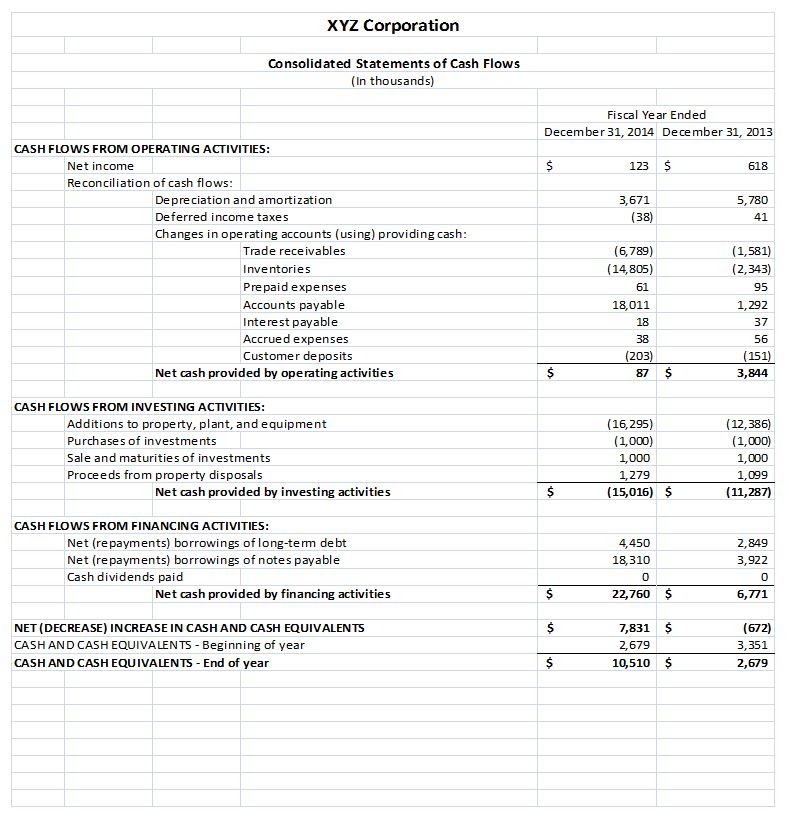
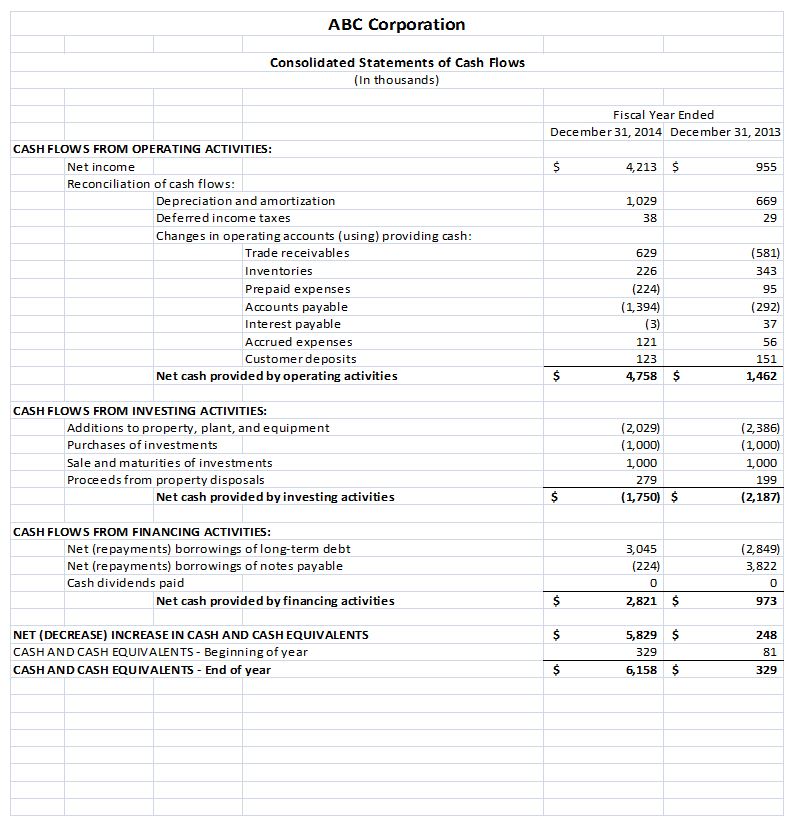
Statement of Cash Flows: While the income statement can tell a reader whether a company made a profit based on receipts, a statement of cash flows can tell a reader whether or not the company generated cash from these receipts. Many financial statement users are vitally interested in the actual cash received since sales receipts alone cannot pay creditors, which makes this statement very important. The statement of cash flows uses the amounts from the income statement as well as the period-over-period changes from the balance sheet to outline the trail of the inflows and outflows of cash. Under the indirect method of preparing the statement of cash flows, the statement uses the accrual method figures from the income statement and adjusts them up or down depending on the changes in the balance sheet accounts from the prior period. Using the direct method of preparing the statement of cash flows, the accountant shows the items that affect cash flow, such as cash collected from customers, interest received, cash paid to suppliers, etc. The statement of cash flows gives the reader the true picture of the sources of cash (starting with net income/loss using the indirect method) and the uses of that cash. This statement is broken out into three activities: cash flow from operating activities, cash flow from investing activities, and cash flow from financing activities. This way an analyst can easily dissect the cash flows of a business and be able to look at operating cash flows separately from the other activities. This statement ultimately reconciles the difference between the cash on hand at the beginning of a balance sheet period to the end period balance of cash on hand.
Examples of these four basic financial statements have been included as exhibits in the appendix for two fictitious companies: ABC Corporation and XYZ Corporation. ABC Corp. is an example of a financially strong company and XYZ Corp. is an example of a weaker company that would pose heightened credit risk requiring additional steps and information that would be needed in order to potentially approve them for credit. The financial statements in the appendix are used to work through the five categories of ratios that will be discussed in detail. The five categories of ratios are as follows: leverage, liquidity, efficiency, profitability, and debt coverage ratios. The individual ratios in these five categories will be further discussed to educate a credit professional on the basics of credit analysis. It should be noted that financial ratios should be used with caution and common sense, and they should be used in combination with other elements of financial analysis. In addition, there is no one definitive set of key financial ratios, there is no uniform definition for all ratios, and there is no standard that should be met for each ratio.
Notes: In addition to the four basic financial statements, there are also notes to the financial statements that are found after these four basic financial statements on audited financial statements and many reviewed financial statements. Although the appendix of this guide does not include an example of notes to the financial statements, this is a very important section of the financial statements that should also be analyzed by a credit professional. Notes help to further explain the numbers that are in the four basic financial statements such as inventory valuation methods, depreciation methods, and debt repayment terms, to name a few. The notes also help to analyze the strength of a company by including additional information that can’t be found in the numbers such as bank information (line of credit commitment amounts, maturity dates, and covenant information), subsequent events, and contingent liabilities, as well as other important items. These important disclosures should be read carefully by the credit professional as they may end up making or breaking a credit decision.
There are many equations and ratios in financial statement analysis, but there is only one known as the accounting equation. The accounting equation displays that all assets are either financed by borrowing money or paying with the money of the company's shareholders. The reason the balance sheet is called a balance sheet can be demonstrated with this very simple yet often poorly understood equation.
Assets = Liabilities + Equity
This equation represents the left side of the balance sheet (assets), which is equal to the right side of the balance sheet (liabilities + equity). The fact that the totals on the left and right side of the balance sheet should match is why it is called a “balance” sheet. Each side is a picture of the company and their assets, capital, and debt structure. The left side (assets) shows everything a company owns, and the right side (liabilities + equity) shows how those assets are financed. It is important to understand the left side of the balance sheet and how assets are broken down into long-term and short-term assets. An asset is categorized as long-term or short-term based on the projected period of time it will take before that asset is converted into cash (liquidated). Changes in what percentage of assets are long-term and less likely or more difficult to be converted into cash (less liquid) and what percentage are short-term and easier to convert into cash (more liquid) can have dramatic implications on a company’s ability to pay its bills and meet other operating commitments. Understanding the asset structure and liquidity of an organization is very important and will be covered further in another chapter. For the purposes of this section, we are going to focus on the right side of the balance sheet and how a company’s assets are financed.
As stated above, the right side of the balance sheet, or the accounting equation (liabilities + equity), show how a company’s assets are financed. It is worth noting that liabilities=debt, and equity=net worth. Don’t be confused to hear or see these terms used interchangeably; they are the same. No matter how large or small a company is, every asset is financed with capital from debt or equity. Imagine all of a company’s assets boiled down to a single dollar which represents every asset within the company. That dollar can be broken down into what % is financed by creditors (liabilities) and what percent is financed by contributions from owners/investors (equity). The higher the % of assets financed by creditors/liabilities, the higher the leverage of the company. This is a very important concept to understand as a creditor because as leverage increases and more of the company’s assets are financed by debt, the higher the burden of risk becomes for the creditors. The percentage of assets financed by debt can be measured with a variety of different metrics, some of which will be discussed below. The standard for those leverage metrics will vary widely by industry, so it is helpful to have an idea of what metrics would look like for a typical company in a given industry. Throughout this guide we will be referencing excerpts from two very different example companies (ABC Corp. and XYZ Corp.). Both of these companies’ financial statements can be found in the appendix to this paper. Below are calculations and analysis of three common leverage ratios:
1) Debt to Equity ratio: Total Liabilities divided by Total Equity.
Total Liabilities
Total Equity
Total debt to equity can be a very helpful tool when trying to understand how leveraged a company may be. The higher the debt to equity ratio, the more leveraged a company is. Stated another way, a high debt to equity ratio means more of the company’s assets are financed through debt, and the higher the burden of risk for creditors. If a company’s debt to equity were equal to 2, then for every $1 in equity the company has $2 in debt. If the debt to equity ratio is less than 1, the company has more equity than debt. For example a debt to equity ratio of .50 would mean that for every $1 in equity the company has $.50 in debt. If the debt to equity ratio is negative, the company has negative net worth and is insolvent. Insolvency likely represents a much higher risk for creditors due to a much higher likelihood the company will default on future debt or other obligations.
ABC Corp:
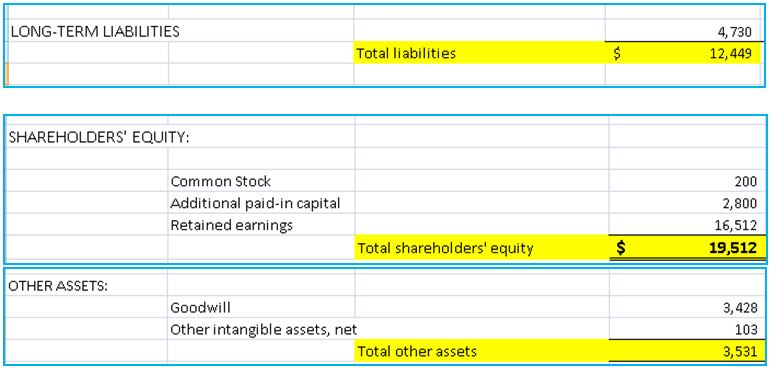
Example ABC Corp: $12,449 = 0.64
$19,512 =
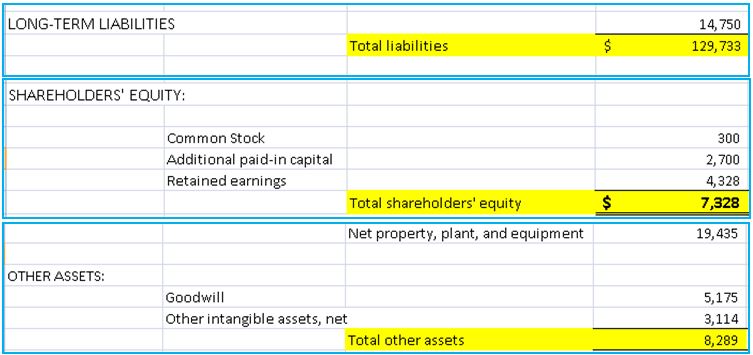
Example XYZ Corp: $129,733 = 17.7
$7,328 =
In the examples above, the total debt to equity for ABC Corp. shows for every dollar in equity there is $0.64 in debt. We know that because the debt to equity is below 1.0, meaning that ABC Corp has more equity than debt. XYZ Corp. on the other hand shows that there is $17.70 in debt for every $1 in equity. XYZ Corp. is much more leveraged than ABC Corp., which would likely mean an increased risk for creditors.
2) Debt to Tangible Net Worth: Total Liabilities divided by Tangible Net Worth.
Tangible Net Worth is the Total Equity minus the total of Intangible Assets.
_____Total Liabilities_____
(Equity - Intangible Assets)
The total debt to tangible net worth is essentially the same ratio as the debt to equity calculation in example 1 above but with the removal of intangible assets from equity. Intangible assets are usually not able to be liquidated (converted into cash), and thus they are rarely able to assist a company in meeting its debt obligations. It is thus very important to understand how a company’s intangible assets may be shaping their leverage and debt to equity ratio.
ABC Corp:
Example ABC Corp: $12,449 = 0.78
$(19,512 - 3,531) =
XYZ Corp:
Example XYZ Corp: $129,773 = -135.0
$(7,328-8,289)
In the case of ABC Corp. above, the removal of intangible assets has a minimal effect on the leverage, going from a total debt to equity of 0.64 to a total debt to tangible net worth of 0.78. This does not represent a large change, and would likely not dramatically change our perception of the company or the risk of extending them credit. However, in the case of XYZ Corp., the removal of intangible assets caused tangible net worth to become negative. This means that without relying on the value of these intangible assets, the company owes more to its creditors than the value of all of its tangible assets combined. This indicates a very high risk position for creditors of XYZ Corp., and it would be reasonable to expect a higher probability of bankruptcy and/or default on the debt.
3) Assets to Equity (Leverage Ratio): Total Assets divided by Total Equity
Total Assets
Equity
The total asset to equity ratio, also known as the leverage ratio, shows the total assets of a company compared to equity. Stated another way, if a company has a high leverage ratio or their leverage ratio is growing, they are more leveraged and a higher percentage of their assets are being financed through borrowing from creditors as opposed to being financed by investment from owners.
ABC Corp:
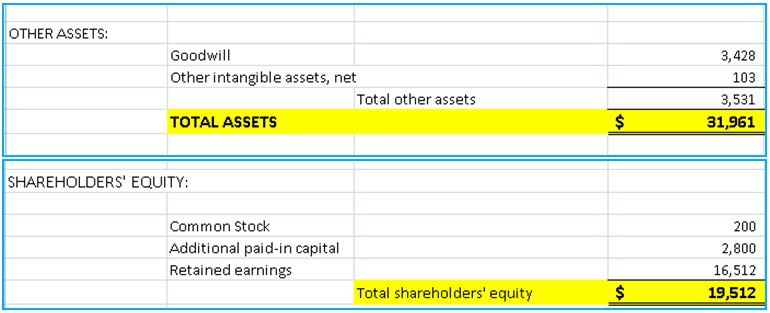
Example ABC Corp: $31,961 = 1.64
$19,512
XYZ Corp:
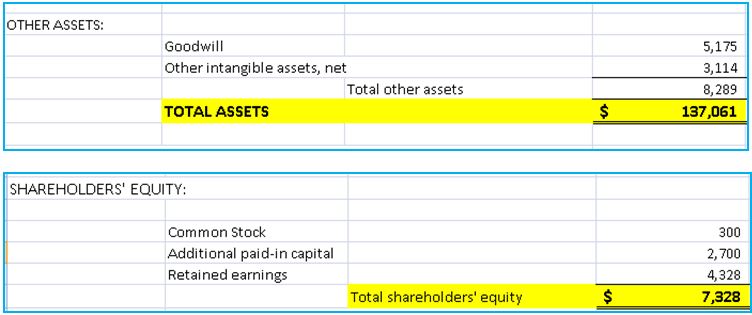
Example XYZ Corp: $137,061 = 18.7
$7,328
In the examples above, ABC Corp. has a leverage ratio of 1.64, so for every $1 in equity the company has $0.64 in debt/liabilities. You can tell from their leverage ratio, that the majority of the assets of the company are equity financed, and thus they have lower leverage and would likely represent less risk for a creditor. Conversely, XYZ Corp. has a leverage ratio of 18.7, so for every $1 in equity there is $17.70 in debt/liabilities. Clearly, XYZ Corp. is much more leveraged than ABC Corp., and that would make them a much higher credit risk. If the leverage ratio equals 1, then the company has no debt, and everything they own is owned outright by the company’s owners. If the leverage ratio goes below 1 and is negative, that means a company has negative net worth. Having a negative leverage ratio would result in a higher probability of bankruptcy and thus a higher credit risk.
You will notice that the leverage ratio is higher than the total debt to equity ratio by exactly 1. This will always be the case due to the accounting equation (assets = liabilities + equity). Based on the accounting equation, the leverage ratio can be used interchangeably with the total debt to equity ratio to get to the same conclusion on the leverage and related risk of a company. Both ratios are shown since credit departments prefer to stay consistent, and some use the leverage ratio while others use the total debt to equity ratio. In addition, the leverage ratio can be used in more advanced financial analysis when using the DuPont analysis for calculating the return on equity of a business (discussed in more advanced readings).
It is important to understand how leverage and changes to leverage affect a company’s financial strength and help us predict their ability to repay debt. As a rule of thumb, higher debt means higher leverage and higher leverage means increased risk to creditors.
Liquidity
What is liquidity? And why is it so important for the credit professional to understand it? Specifically, liquidity is the ability of an enterprise to generate sufficient cash amounts (from the conversion of their raw material purchases, product development, product sales, and cash collection - also known as the ‘Cash Conversion Cycle’) to meet their own firm’s required cash needs in order to properly operate their day-to-day business. Generally speaking, a trade creditor (like the company you work for), has very short customer credit terms (i.e. Net-7, 10, 15, or 30) with their debtors (or customers); hence, a customers’ liquidity position, or solvency readings, becomes very important to quantify (and gauge) from a credit management standpoint.
If your firm’s standard credit terms are Net-30, then you’d expect your customers to pay you in 30 to 35 days. Calculating the more common ‘liquidity metrics’ (which we’ll do below) will give you (the credit professional) more confidence in your customer’s ability to pay your firm on a timely basis, after you have released your firm’s products to them. There are three ‘key’ liquidity ratios (of which all of their components are found on a standard balance sheet) as shown below:
- Current Ratio
- Quick Ratio
- Net Working Capital
These three ratios are explained in detail below and looked at between two different companies: ABC Corporation and XYZ Corporation:
Current Ratio: Total current assets divided by the total current liabilities:
Total Current Assets
Total Current Liabilities
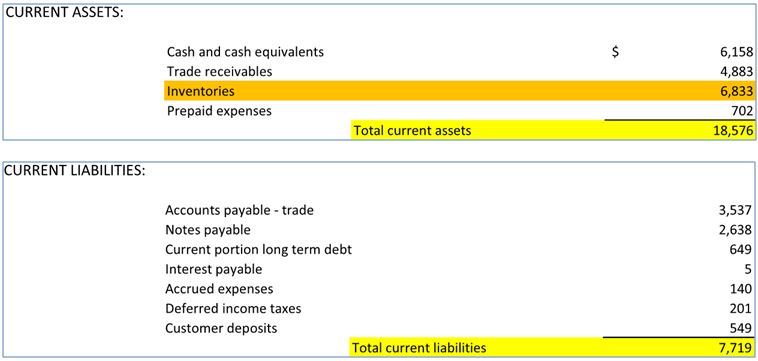
The current ratio (shown above) is probably the most widely used of all the liquidity ratios. (Note: This ratio is simply a measure of how many times your customer’s total current assets (which generally consists of: cash, accounts receivable (AR), pre-paid assets, inventory, etc.) can ‘cover’ their total current liabilities (which generally consists of: accounts payable, debt due within one year, notes payable, accrued liabilities, etc.). Since this is a ratio we are working with, the outcome your calculation produces is something compared to the number ‘1.’ So, in the below example, and shown on any GAAP balance sheet, you’ll be able to discern how many times your customer’s total current assets can cover (i.e. 1x, 1.5x, 2x, etc.) their total current liabilities, which, of course, would include your firm’s invoices to this customer.
Obviously, the higher the final calculated ratio, the better the chance of your company getting paid, and hopefully within your assigned customer credit terms. Generally speaking, you’ll want to see a current ratio result of over 1.5 to 2.0 times, which would indicate a healthy result; but, this result should be compared to your company’s related industry average for their peers as well. Below are calculations and analysis of liquidity ratios using our example companies, ABC Corp. and XYZ Corp:
ABC Corp:
ABC Corp: Current Ratio= $18,576 = 2.41 ( also expressed as 2.41x or 2.41:1)
$7,719
XYZ Corp:
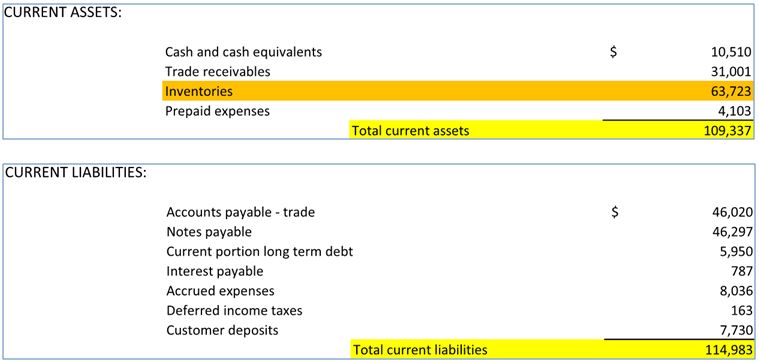
XYZ Corp: Current Ratio=$109,337 = 0.95(also expressed as 0.95x or 0.95:1)
$114,983
The current ratio (CR) result for ABC Corp. of 2.41:1 suggests that there is $2.41 of current assets for every $1.00 of current liabilities, which is usually a good sign. As a comparison, however, XYZ Corp.’s CR of less than 1, at 0.95:1, suggests this firm has only $0.95 to cover $1.00 of their current liabilities. This could portend a potential problem. However, it would have to be further looked into because some industries have very low CR results and have no problem paying their vendors.
Quick Ratio: Total current assets minus the inventory amount, all divided by the total current liabilities:
Total Current Assets - Inventory
Total Current Liabilities
The second key liquidity ratio (shown above) is the quick ratio (QR). The QR is calculated the same as the CR, but you would subtract the customers’ inventory amount shown in the total current asset section of the balance sheet. This ratio is also called the acid test ratio. We subtract the inventory balance (and some finance professionals also subtract the ‘prepaid assets’ amount, too) because inventory is the ‘least’ liquid (i.e. it could take the longest to be converted into actual cash) of all the total current asset components. Here’s a quick example of this ratio for these two different companies:
ABC Corp: Quick Ratio = $18,576 - $6,833 = 1.52:1
$ 7,719
XYZ Corp: Quick Ratio = $109,337 - $63,723 = 0.40:1
$114,983
You’ll note that the above result for the ABC Corp. (1.52:1) is a smaller ratio than the current ratio result shown above (2.41:1) because we have subtracted for the Inventory amount and hence made the numerator a smaller number. The above result would suggest that this customer (ABC Corp.) should be able to service their short-term debt (total current liabilities) without first having to sell-off their inventory to raise additional liquidity (cash) to pay their short-term obligations. We would read this result as this customer has $1.52 in ‘quick’ assets, for every $1.00 in total current liabilities (which would, again, include your firm’s invoices to this customer). Then if we look at XYZ Corp.’s quick ratio result of only 0.40:1, this would imply that XYZ Corp. only has $0.40 for each $1.00 of their current liabilities. This could pose a problem for XYZ Corp. should they have a problem converting their inventories into salable products. Again, as with all ratios, the quick ratio should be monitored for period-over-period trends (both positive and negative) and also compared to your firm’s industry norms as well.
Net Working Capital: Total current assets minus total current liabilities
Total Current Assets - Total Current Liabilities
The third liquidity calculation (and remember, there are other liquidity ratios used in actual practice) is the net working capital calculation, shown above. This calculation is used to designate the amount by which current assets exceed (or are less than) current liabilities. Simply put:
ABC Corp: Net Working Capital = $18,576 - $7,719 = $10,857
XYZ Corp: Net Working Capital = $109,337 - $114,983 = ($5,646) or -$5,646
The net working capital amount actually quantifies a liquidity (or solvency amount) in dollar terms. Unlike the above two methods which are ratios (some result compared to the number 1), this amount actually shows the credit professional the ‘actual’ dollars available to finance trade creditors. Some firms like to reduce the amounts they have ‘tied up’ in their net working capital amounts to help reduce their carrying (interest) costs with their lenders; however, this can make them less credit worthy.
As shown above, ABC Corp. has a ‘positive’ working capital position of $10,857k. This would imply a favorable result. However, some further research the credit professional would need to do to believe this would be to understand their customer’s monthly payment requirements for items such as: interest costs, A/P requirements, long & short term principal payments, and other monthly operating expenses required to keep their company doors open. In contrast, XYZ Corp. has a ‘negative’ working capital position of ($5,646k). This could imply a problem with this firm meeting their day-to-day operating costs. The credit professional would need to delve more into this customer’s monthly cash requirements to see if this customer would be a potential credit risk and not be able to pay your firm’s invoices by your assigned credit terms.
Also, if a firm is getting paid very quickly from their customers (like in 1 or 2 days, like a retailer or firms in the petroleum industry whom have very brief customer sales terms), and then their vendors give them much longer sales terms (like Net-15 or Net-30), this could skew a firm’s net working capital result that’s being reported. Again, this gets back to knowing your firm’s industry credit practices and becoming more informed of overall credit management principles in general.
Efficiency
Efficiency metrics measure how effectively the company utilizes its assets and how well it manages its liabilities. Top performing companies turnover assets quickly and efficiently, that is to say they have a high “run rate.” Some key areas of efficiency, especially to the business credit professional, are those associated with short-term assets and liabilities. These ratios are able to tell us a lot about how efficiently and effectively a company is managing its short-term operations and working capital investments.
Keys to comparison:
- Industry: the ratio will vary from one industry to another.
- Year-to-year: trending analysis is very important. Performance of this year needs to compare with previous years’ performance to analyze the abnormalities. Seasonality of a business can potentially skew the efficiency ratios of a company when analyzed month-to-month or quarter-to-quarter.
Accounts Receivable Turnover: Sales divided by accounts receivable:
Sales
Accounts Receivable
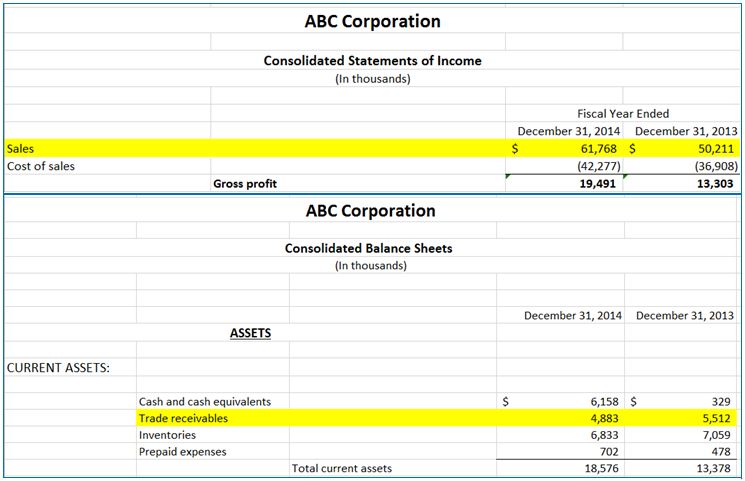
Accounts receivable turnover measures the effectiveness of a company’s sales terms and collection policy. The sooner that accounts receivable can be collected, the sooner cash is available for use. A lower turnover number may suggest the company is too lenient on credit terms or having difficulty to collect. A higher turnover number is better because it has a low days sales outstanding (DSO). Rising DSOs could increase uncollectible receivables that lead to bad debts. If a company has bad debts that have not yet been written off, then this would negatively impact nearly every other ratio that is discussed in this paper. In addition, the quality of the company’s sales might have to be questioned going forward.
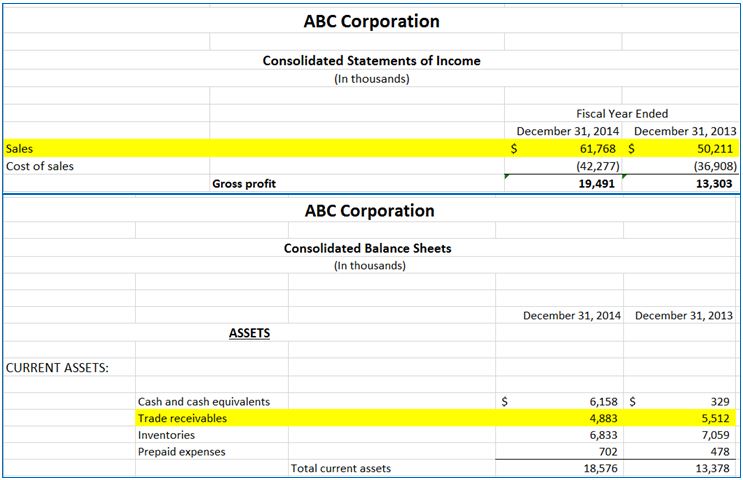
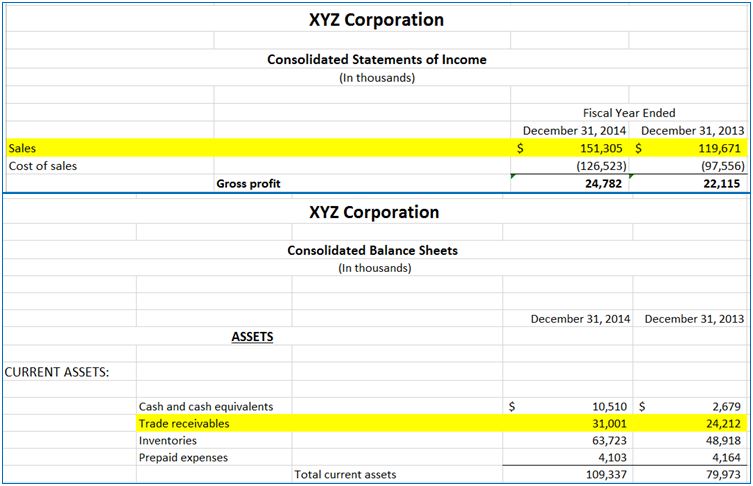
To calculate this ratio, we need to get information of the sales (or revenue) from the customer’s income statement and accounts (or trade) receivable from the balance sheet under the current assets category.
ABC Corp:
ABC Corp: Accounts Receivables Turnover= $61,768 = 12.65 times per year
$4,883
XYZ Corp:
XYZ Corp: Accounts Receivables Turnover=$151,305 = 4.88 times per year
$31,001
Days Sales Outstanding (DSO): 365 days divided by accounts receivable turnover:
365 days
Accounts Receivable Turnover
Days sales outstanding (DSO) measures the average number of days it takes a company to convert its accounts receivable into cash. Lesser days are better because it takes less time to collect the customer’s accounts receivable.
ABC Corp: 365/12.65 = 29 days
XYZ Corp: 365/4.88 = 75 days
The accounts receivable turnover result for ABC Corp. suggests that ABC Corp. collected all of their accounts receivable balance 12.65 times per year, on average. It also means ABC Corp. took 29 days on average to collect their accounts receivable. The accounts receivable turnover result for XYZ Corp. suggests that XYZ Corp. collected all of their accounts receivable balance 4.88 times per year, on average. It also means XYZ Corp. took 75 days on average to collect their accounts receivable. In this calculation, we can see there is either something in XYZ’s credit policy that is causing them longer to collect, or they have potential bad debts that might need to be written off. XYZ Corp.’s cash is all tied up in receivables.
Inventory Turnover Ratio: Cost of goods sold divided by inventory:
Cost of Goods Sold
Inventory
The inventory turnover ratio measures how many times a company’s inventory is sold and replaced over a year. A higher inventory turnover ratio is better because it has a low days inventory outstanding (DIO). A low inventory turnover ratio may indicate overbuying, falling sales, unaccounted for shrinkage, or excessive carryover of obsolete inventory. If a company has shrinkage or obsolete inventory that has not been accounted for, these amounts may have to be written off (expensed), which would negatively impact nearly every other ratio that is discussed in this paper. In addition, the quality of the company’s inventory management, and even possibly sales, might have to be questioned going forward.
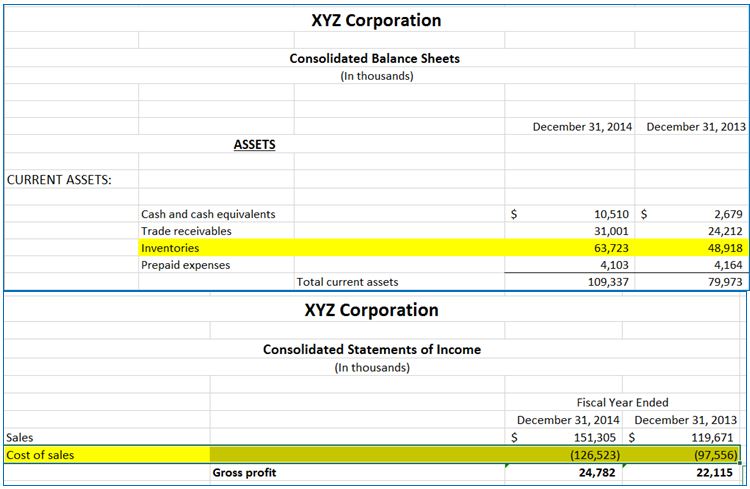
To calculate this ratio, we need to get information of the cost of goods sold from the income statement and inventories from the balance sheet under the current assets category.
ABC Corp:
ABC Corp: Inventory Turnover = $42,277 = 6.19 times per year
$6,833
XYZ Corp:
XYZ Corp: Inventory Turnover =$126,523 = 1.99 times per year
$63,723
Days Inventory Outstanding (DIO): 365 days divided by inventory turnover.
365 days
Inventory Turnover
Days inventory outstanding (DIO) measures how many days on average it takes to sell a company’s inventory. A lower DIO is better because it takes less time to sell inventory.
ABC Corp: 365/6.19 = 59 days
XYZ Corp: 365/1.99 = 184 days
The inventory turnover ratio result for ABC Corp. suggests that ABC Corp. sold and replaced their total inventory balance 6.19 times per year, on average. It means ABC Corp. has about 59 days’ worth of inventory on hand to support average sales. The inventory turnover ratio result for XYZ Corp. suggests that XYZ Corp. sold and replaced their total inventory balance 1.99 times per year, on average. It means XYZ Corp. has about 184 days’ worth of inventory on hand to support average sales. In comparison, ABC Corp. performed better than XYZ Corp. when turning their inventory into cash. XYZ Corp. might be carrying an excessive amount of inventory or might be overbuying materials/products for future sales needs. This should be analyzed further to see if there is obsolete inventory or shrinkage that has not been accounted for and needs to be written off (expensed).
Accounts Payable Turnover: Cost of goods sold divided by accounts payable
Cost of Goods Sold
Accounts Payable
Accounts payable turnover measures how a company manages paying its own bills. A higher turnover means there is possibility that the company doesn’t have favorable terms from its suppliers. A lower number of accounts payable turnover helps to stretch the working capital and free cash flow with longer days payable outstanding (DPO). As a creditor, a higher turnover is preferred because it is a prediction of how the company will pay their vendors.
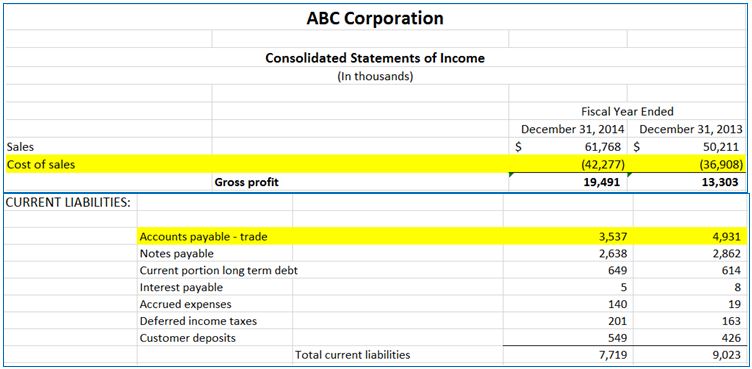
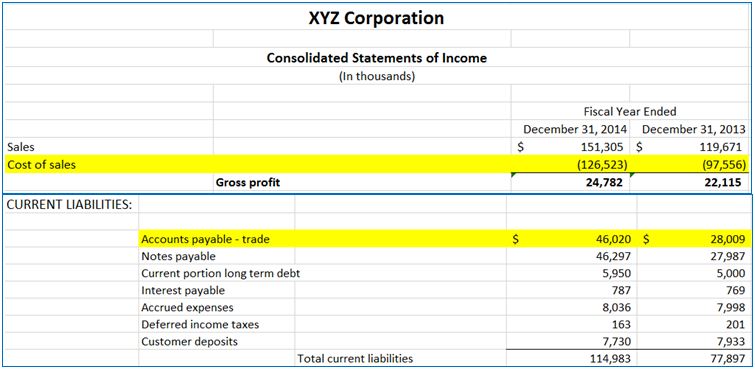
To calculate this ratio, we need to get information of the cost of goods sold from the income statement and accounts payable from the balance sheet under the current liabilities category.
ABC Corp:
ABC Corp: Accounts Payable Turnover = $42,277 = 11.95 times per year
$3,537
XYZ Corp:
XYZ Corp: Accounts Payable Turnover = $126,523 = 2.75 times per year
$46,020
Days Payable Outstanding (DPO): 365 days divided by accounts payable turnover
365 days
Accounts Payable Turnover
Days payable outstanding measures how many days that the company took to pay its vendors. From a credit professional’s perspective, if the number of days is high, it is a potential sign of a company struggling with cash flow and a prediction of a company’s payment schedule to their vendors.
ABC Corp: 365/11.95 = 31 days
XYZ Corp: 365/2.75 = 133 days
The accounts payable turnover result for ABC Corp. suggests that ABC Corp. paid all of their accounts payable balance 11.95 times per year, on average. It also means ABC Corp. took 31 days on average to pay its vendors. The account payable Turnover result for XYZ Corp. suggests that XYZ Corp. paid all of their accounts payable balance 2.75 times per year, on average. It also means XYZ Corp. took 133 days on average to pay its vendors.
In this calculation, we could see XYZ Corp. might be having some problems with its cash flow and they are stretching payables to compensate. They could also just have extended terms with their vendors, but this is worth looking into further especially for potential new customers where payment trends with your company have not yet been established.
Cash Conversion Cycle:
Days sales outstanding + days inventory outstanding – days payable outstanding
DIO + DSO – DPO
“Cash is King!”
This formula measures (in days) the amount of time it takes a company to convert its investments into cash, or how long it takes a company to collect cash from sales of its inventory. When understanding the cash conversion cycle, it is helpful to remember that any dollars in inventory and accounts receivable are investments in working capital that have not yet been converted into cash. Conversely any amount in accounts payable is working capital being financed by trade creditors and is allowing the company to delay spending their cash. Any investments in inventory or receivables are essentially cash that a company has not collected yet and will decrease the overall cash available to the company to finance operations.
From the calculation above, ABC Corp. took 57 days and XYZ Corp. took 126 days to turn their investments into cash. We could see that XYZ Corp. is having problems generating cash. This explains why they took longer to pay their vendors.
Note: This measurement is not as effective for service companies such as consulting businesses, technology companies, and insurance companies that have little to no inventory and might even have very quick accounts receivable turnover.
Profitability
In this next section we will discuss profitability ratios. Wikipedia, Investopedia, and Bloomberg, all tell us that profitability ratios are basically metrics used to assess a business’ ability to generate earnings as compared to its expense and cover cost over a specific period. Profitability is also sometimes analyzed through earnings performance ratios. No matter what you refer to them as, they always have to do with the return on something (i.e. sales, assets, etc.). In this section we will explore three primary profitability ratios:
- Net Profit Margin
- Gross Profit Margin
- Operating Profit Margin
These ratios by themselves may yield some insight and will definitely be helpful in analyzing whether to extend credit to a customer or to determine their long term viability. You will want to use these ratios in conjunction with the other ratios discussed in this paper to get a better picture of a customer’s financial position and whether or not you want to give them open credit terms. The Securities and Exchange Commission (SEC) requires all publicly traded companies to file quarterly and yearly financials (i.e. 8k and 10k). These reports will be based on the approved GAAP requirements. For those publicly traded companies that you are doing business with, this can really help in your validation and trending models because there will be multiple months and years on file. For private companies, you will want to ask for three years, three quarter-ends, or three month-ends of data to determine a trend. The best comparison is when you can compare year-over-year to see how they are doing and compare with other like companies in the same industry. In the previous sections, we discussed how benchmarking against like companies within the same year can be helpful to analyze a company’s financial strength. This should give each credit professional the ability to analyze the current statement in a meaning full way by reviewing a trend to determine what you think will happen in the future. All of the information you need for this section can be found on the income statement. The ratios below will help you to determine the health of a company or how much credit risk your company’s policy will allow.
One of the most common profitability ratios is the net profit margin. This is also sometimes referred to as the bottom line margin. Here the number is expressed as a percentage and should be above zero. This is kind of a no brainer as a company should be profitable to stay in business. This is one of the most frequently used ratios. The net profit of a business will tell you what’s left over after all expenses/costs are taken out of sales. Historical net profit margins provide the analyst with the ability to determine if the customer is trending up or down. Are they making as much money as their competitors? Did the profit margin increase from the prior periods or did it decrease?
Net Profit Margin: Net income after tax divided by net sales:
Net Income after Tax
Net Sales
ABC Corp:

ABC Corp: Net Profit margin = $4,213 = 0.0682 (also expressed as 6.82%)
$61,768
XYZ Corp:

XYZ Corp: Net Profit margin = $123 = 0.00081 (also expressed as .08%)
$151,305
While both companies have a positive net profit margin, it’s obvious that ABC Corp. is doing better than XYZ Corp. Assuming that both companies are from the same industry, we could make an assumption that ABC Corp. is controlling its expenses much better than XYZ Corp. If these companies are not from the same industry, it still won’t matter for XYZ Corp. because they are just barely breaking even. One other thing to be considered is the type of industry of the company you are evaluating. You should have a good understanding of what the margins should be in the industry you are evaluating. For example, the service industry typically has 15% to 30% margins. If either company, ABC Corp. or XYZ Corp., were in the service industry, we would say both were not doing as well as related companies in their industry.
Gross Profit Margin: Gross profit divided by net sales
Gross Profit
Net Sales
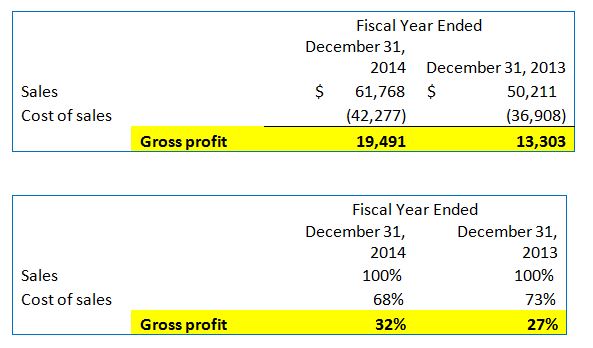
Gross profit margin can be a great asset to any credit professional. If a company is able to increase their gross profit margin month after month or quarter after quarter, this typically means the company is increasing their sales prices and/or they are able to lower their direct input costs. A good example of this is where a company can increase sales at existing prices, but takes advantage of economies of scale to buy materials/products in bulk at lower costs. In the chart below, we see from year-to-year the gross profit dollars increased from $13,303 to $19,491. In the second chart below, we expressed the same numbers as a percentage to give you a better perspective to how these companies manage their cost of goods sold. ABC Corp. not only increases its gross profit dollars, but as you can see from the second chart, the percentage of gross margin increased 5% from 2013 to 2014.
ABC Corp:
In this second example (below) we can see where XYZ Corp. made an additional $2.7M in gross profit; however, the gross margin actually dropped 3%. This is a good example where the numbers alone don’t necessarily tell you the whole story.
XYZ Corp:
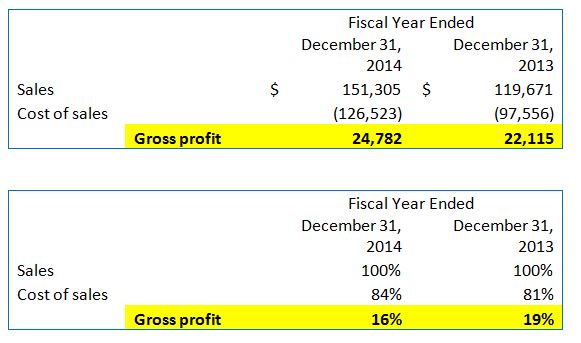
Now you will need to determine if this is good or bad. ABC Corp. is growing their margins while XYZ Corp.’s margin is getting compressed. Here you would want to do more analysis and ask some follow up questions for XYZ Corp. For example, expenses outpaced sales as a percentage, why? You may be able to figure this out if you have a detailed page breaking out cost of goods sold.
The last ratio on profitably will be operating profit margins. This ratio is primarily used to measure a company’s pricing strategy and operating efficiency. The operating profit margin measures the part of the company’s revenue remaining after paying production cost, such as wages, raw materials, etc.
Operating Profit Margin: Operating income divided by net sales
Operating Income
Net Sales
ABC Corp:

ABC Corp: Operating Profit margin = $6,824 = 0.1104 (also expressed as 11%)
$61,768
XYZ Corp:

XYZ Corp: Operating Profit margin = $3,855 = 0.0254 (also expressed as 2.5%)
$151,305
When determining your operating income and net sales make sure you don’t include things outside of the operating portion of the financial statement, for example one-time expense for a settlement, or some sort of other nonrecurring income/expense. The higher the operating profit margin, the better cost controls a company has. When a company is well established and been in business for a number of years, fixed cost should go down and thereby the operating profit margin go up. Here you want to see a trend where the operating profit margin is increasing every quarter and year. So it’s important to not just do the calculation on the current financials but look at previous months, quarters, and/or years.
Debt Coverage
A creditor is ultimately concerned with the ability of an existing or prospective borrower to make interest and principal payments on borrowed funds. If a company you are selling to is no longer in good standing with their bank due to the inability to meet covenants or the inability to pay their loans, then the company will either have to seek funding from their vendors by stretching their bills, or file for bankruptcy. Either way it is very important for you, as a vendor, to understand this relationship and analyze a company’s ability to pay their debt obligations. A profitable business does not necessarily mean that there is enough income or cash flow to support its debt payments. If you are analyzing a company that is profitable, how can you determine the strength of their profits? One million dollars ($1M) in net income or even operating cash flow sounds great, but what does it really mean for the company? This amount might be sufficient for a company with total debt of $1M, but it may not be good at all for a company with total debt of $100M depending on the structure of required payments. In order to fully analyze the strength of a company’s income and cash flow, it has to be compared against the required debt payments that the company needs to make. To fully analyze this relationship of income and cash flow compared to debt service, 3 basic ratios have been outlined below:
- Times Interest Earned Ratio
- Debt Service Coverage Ratio
- Cash Flow from Operations Debt Service Coverage Ratio
These three ratios are further defined in detail below. In addition, we will walk through differences in these ratios when analyzing the financials of ABC Corporation and XYZ Corporation.
Times Interest Earned Ratio: The times interest earned ratio is expressed as the operating income of the company divided by the interest expense of that company:
Operating Income
Interest Expense
The operating income of a company can be found as a subtotal on the company’s income statement after all operating expenses have been taken into account. Other income/expenses can often fluctuate and include one-time items, but the operating income/profit represents the income from core (normal) operations. Interest expense can be found as a line item on the income statement. This is the amount of interest that was due and payable in the particular period that the income statement covers. These amounts for ABC Corp. and XYZ Corp. are shown below and highlighted in yellow:
ABC Corp:

ABC Corp: Times Interest Earned Ratio = $6,824 = 29.93 (also expressed as 29.93x or 29.93:1)
$228
XYZ Corp:

XYZ Corp: Times Interest Earned Ratio = $3,855 = 1.17 (also expressed as 1.17x or 1.17:1)
$3,308
If the ratio is over 1, this means that the normal operations of the business are profitable enough to pay the interest payments on the company’s debt. An average company will have a cushion, perhaps a ratio of 1.50:1.00 (1.50x) or higher. This helps to apply additional funds towards principal/debt reductions or to help during periods when operations are not as strong. As shown above with ABC Corp. and XYZ Corp., both companies have a ratio over 1 and can both support interest only payments; however, ABC Corp. has a sizable cushion over 1, whereas XYZ Corp. has a much smaller cushion over 1. When subtracting interest expense from operating income, XYZ Corp. only has $547k to cover other cash needs such as taxes, distributions/dividends, principal debt payments, capital expenditures, etc.
Covering required interest payments should be maintained at a minimum. In addition to this, many companies have liabilities that require principal payments to reduce the balance on the debt over a set period of time. For instance, equipment depreciates and loses value over time, so a business will need to make principal payments on this debt to avoid having its loan value exceed the value of its asset. The next two ratios help to analyze the full ability of a company to service its required debt payments.
Debt Service Coverage Ratio: The debt service coverage ratio is expressed as the earnings/income (E) of a company before (B) the sum of interest expense (I), depreciation (D), amortization (A), and any other non-cash items (together represented as EBIDA), divided by the sum of current portion of long-term debt (CPLTD), current portion of capital
Net Income + Interest Expense + Depreciation + Amortization
CPLTD + Current Portion of Capital Leases + Interest Expense
Although EBITDA is not a financial measure recognized in GAAP, it is commonly used in finance and by banks to assess the performance of a company. The “T” in EBITDA stands for taxes. The reason why taxes have not been added back to the ratio calculation above is because taxes are equally, if not more important as paying back bank loans. Federal and state tax liens can prevent a company from obtaining funding and negatively impact their cash flow. Depreciation and amortization expenses are added back to net income since these are non-cash expenses and can be used to help service debt. These expenses can be found as a line item on the income statement or on the statement of cash flows. Since interest expense is one of the primary debt payments as shown in the previous ratio, we would also add back interest expense to the numerator. The current portions of both long-term debt and capital leases can be found under current liabilities on the balance sheet. These represent the amount of principal payments that are due within the next year. Loans/leases can be refinanced, paid off early, or issued throughout the course of a year so these amounts are simply good estimates. The figures needed for this ratio calculation for ABC Corp. and XYZ Corp. (not including interest expense as shown earlier) are shown below and highlighted in yellow:
ABC Corp:

ABC Corp: Debt Service Coverage Ratio = $4,213 + $228 + $1,029 = 6.24x
$649 + $228
XYZ Corp:

XYZ Corp: Debt Service Coverage Ratio = $123 + $3,308 + $3,671 = 0.77x
$5,950 + $3,308
Just like the last ratio, if this ratio is over 1, than this means that the company has the ability to make their required debt payments. An average company will have a cushion of 1.25x or higher to help during slow periods or when floating interest rate debt is on the rise. As shown above with ABC Corp. and XYZ Corp., the financial performance of these two companies is further differentiated as we move from the times interest earned ratio to the debt service coverage ratio. ABC Corp. still maintains a very strong ratio, whereas XYZ Corp.’s ratio is less than 1 and cannot afford to make the large required principal payments of $5,950k that come due next year if they maintain the same EBIDA.
Operating profit and EBIDA in most cases is based on the accrual method of accounting, meaning that revenues and expenses are entered when invoices are issued, not when they are paid. Just because a sale was made does not mean that the company has collected the receivable and has the cash on hand in order to pay the interest [and principal] that is due. Debt cannot be paid with A/R; only cash can service debt payments. For this reason, we then use cash flow from operations in the numerator instead of EBIDA.
Cash Flow from Operations Debt Service Coverage Ratio: This ratio is the same as the one above, but uses the cash flow from operations instead of EBIDA in the numerator:
Cash Flow from Operations*
CPLTD + Current Portion of Capital Leases + Interest Expense
*Interest expense should be added back if using the indirect method.
The cash flow from operations can be found as a subtotal on the statement of cash flows. This is the cash flow that has been generated from the operating activities of a company and includes changes in certain balance sheet accounts such as A/R, inventory, and A/P to show the actual cash inflows and outflows of a business. This is slightly different than the operating profit and EBIDA of a company that shows the inflows and outflows of receipts, but does not tell you if they were paid or not. Since most companies use the indirect method starting with net income [and depreciation/amortization] at the top, interest expense will need to be added back just as it was with the last two ratios. The cash flow from operations needed to calculate this ratio for both ABC Corp. and XYZ Corp. have been shown below and highlighted in yellow:
ABC Corp:

ABC Corp: Cash Flow from Operations Debt Service Coverage Ratio = $4,758 + $228 = 5.69x
$649 + $228
XYZ Corp:

XYZ Corp: Cash Flow from Operations Debt Service Coverage Ratio = $87 + $3,308 = 0.37x
$5,950 + $3,308
Again, if the ratio is over 1, then the company generated enough cash to afford its required debt payments; however, a cushion of at least 1.25x is recommended for average companies. Since this ratio includes changes in balance sheet accounts that are only taken at a single point in time, it is not necessarily bad if a company’s ratio is under 1 for a single period. When this occurs, it is important to go back and analyze the efficiency ratios that were discussed previously. As shown previously with the debt service coverage ratio, ABC Corp. continues to show a strong ratio, whereas XYZ Corp.’s ratio continued to decline showing a probable decline in efficiency ratios as previously discussed.
A more advanced debt coverage analysis will include other items, such as additional one-time income/expense items, discretionary expenses, expenses on related party assets, capital expenditures, distributions/dividends, subordinated debt, related party debt, receivables from a related party, balloon payments, and mitigating factors to name a few.
Where Do We Go from Here?
This paper has endeavored to explain some initial ‘starter’ information on the content and how to analyze what’s shown on the four GAAP required financial statements: balance sheet, income statement, statement of shareholders’ equity, and statement of cash flows. This paper has also broadly discussed the various types of audit opinions coupled with some beginning financial statement analysis. Clearly, in our professional field of credit management, an opening guide for new credit professionals to this profession would never be able to adequately cover all that a more seasoned credit professional would (and will) encounter in ‘real’ practice. In fact, most of what we learn, and need to know, is based on just plain work experience and the school of hard knocks. But, this guide has attempted to provide some ‘food for thought’ for a new entrant into the field of credit. However, there’s so much more to learn, and cover.
For those of you who want to take credit management to the ‘next step,’ the balance of this paper will aim to cover the following questions and resources: how could I further advance myself in the field of credit management? Are there any credit designations I could earn to further my knowledge in this field? What’s involved in earning those designations? What other resources are available out there that are commonly used for benchmarking and learning other tools in credit management? Well, let’s examine the first question very briefly on how to advance our career (and knowledge) in the field of commercial credit.
In your credit work, you will no doubt hear about one of a credit professional’s main credit associations called the National Association of Credit Management (NACM). NACM has more than 15,000 members located throughout the United States. NACM affiliated associations offer valuable credit services in formal credit training in the form of: classroom credit classes, online credit classes, webinars, monthly publications, seminars, and annual credit conferences, just to name a few. At your local NACM affiliate, you should be able to get your formal credit training (no matter what your background) and also meet other fellow credit professionals working toward similar goals and objectives.
At most NACM affiliates, they have the resources (courses) that will allow you to complete the more commonly held credit designations of:
- Certified Credit and Risk Analyst (CCRA)
- Credit Business Associate (CBA)
- Credit Business Fellow (CBF)
- Certified Credit Executive (CCE)
For credit professionals aiming to expand their knowledge in the international credit management arena, the following designations are also available:
- Certified International Credit Professional (CICP)
- International Certified Credit Executive (ICCE)
The first three designations require the completion of 10 to 15-week classes in: Credit Principles, Financial Statement Analysis, and Accounting. As you progress to the highest designation of CCE, you will review material in such courses as Credit Law, Business Law, and Advanced Financial Statement Analysis. Each credential requires the passing of a formal exam to demonstrate your mastery of the course material which you’ll have had to pass with a letter grade of ‘C,’ or higher. The international designations are completed mostly on the internet, but are just as rigorous (and comprehensive) in their material and test taking as the ones just discussed.
Earning a credit credential demonstrates that you’re very serious in both advancing your knowledge in the field of credit along with utilizing this information in your day-to-day credit work for your company. This information benefits both you as a credit professional and should also help you to protect one of your firm’s largest assets on their balance sheet: accounts receivable.
Along with credit credentialing, our field has some additional resources that have been around a long time which can also assist in one’s knowledge growth in our profession. For various credit departments ‘benchmarking’ tools and further learning of many different types of credit metrics (and calculations) there is the Credit Research Foundation (CRF) (www.crfonline.org). This is a paid member service, but they do offer a lot of complementary benchmarking reports on many different companies and industries. We already mentioned NACM(www.nacm.org) as an excellent resource for a full suite of credit related services along with their local affiliates. For ‘open’ credit positions in both finance and credit, there’s Robert Half International (RFI) (www.roberthalffinance.org). RFI also offers a complementary ‘annual’ salary survey for those employed in the accounting and finance positions.
A very common resource (among several others) for customer credit reports is Dun & Bradstreet (D&B) (www.dnb.com). D&B reports are run on a subscription type basis, and generally contain the following key credit information: full name of business entity, date business started, company hierarchy, and if there’s been any suits, liens, and/or judgments filed against a company, along with a Paydex score which shows how well (or slow) this company pays their vendors (potentially your company).
A helpful public website for general news on publicly-traded companies (and business news of the day) is Yahoo Finance (http://finance.yahoo.com). This popular website allows one to get the latest news developments on large companies along with investor opinions, financial statement data, and related competition information on companies. Google Finance and other search engines offer similar information as well.
Again, these are just a few credit resources which barely scratch the surface of what’s available to a credit professional and their credit department. But this is a start.
Finally, the authors of this paper wish you the best of luck in your new credit career and we hope you have enjoyed this paper and got as much out of it as we enjoyed writing it. We strongly encourage you to get involved in this very dynamic (and honorable) profession called commercial credit. We are confident that you will find it challenging, personally and professionally fulfilling, and hopefully very rewarding.
We all wish you the best of luck!
Graduate School of Credit and Financial Management – Class of 2016
Charles Edwards, CCE
Vivian Hoang, CCE
Brendon Misik, CCE
Kenny Wine, CCE
John Zummo, CCE
Glossary of Financial Terms and Ratios
Debt to Equity ratio: Total Liabilities divided by Total Equity.
Debt to Tangible Net Worth: Total Liabilities divided by Tangible Net Worth. Tangible Net Worth is the Total Equity minus the total of Intangible Assets.
Assets to Equity (Leverage Ratio): Total Assets divided by Total Equity.
Current Ratio (CR): Total current assets divided by the total current liabilities: should be greater than 1.5.
Quick Ratio (QR): Total current assets minus the inventory amount, all divided by the total current liabilities (also known as the acid test ratio): generally lower than the CR, but should still be above 1 depending on the industry.
Net Working Capital: Total current assets minus total current liabilities: should to be greater than $0.
Accounts Receivable Turnover: Sales divided by accounts receivable.
Days Sales Outstanding (DSO): 365 days divided by accounts receivable turnover.
Inventory Turnover Ratio: Cost of goods sold divided by inventory.
Days Inventory Outstanding (DIO): 365 days divided by inventory turnover.
Accounts Payable Turnover:Cost of goods sold divided by accounts payable.
Days Payable Outstanding (DPO):365 days divided by accounts payable turnover.
Cash Conversion Cycle:Days sales outstanding + days inventory outstanding – days payable outstanding.
Net Profit Margin: Net income after tax divided by net sales: should be greater than 0% and be in line with other like companies in the same industry.
Gross Profit Margin: Gross profit divided by net sales: should be sufficiently greater than 0% and needs to be compared to previous years to assure an upward trend.
Operating Profit Margin: Operating income divided by net sales: should be greater than 0% and should show improvement year-over-year.
Times Interest Earned Ratio: Operating income divided by interest expense: should be over 1 to pay interest expense on debt, and usually has a cushion of 1.5:1 or higher.
Debt Service Coverage Ratio: Earnings/income (E) of a company before (B) the sum of interest expense (I), depreciation (D), amortization (A), and any other non-cash items (together represented as EBIDA), divided by the sum of current portion of long-term debt (CPLTD), current portion of capital leases, and interest expense: should be over 1 to cover required debt payments with healthy companies reporting 1.25:1 or higher.
Cash Flow from Operations Debt Service Coverage Ratio: Cash Flow from Operations (add back interest expense if using the indirect method) divided by the sum of current portion of long-term debt (CPLTD), current portion of capital leases, and interest expense: should be over 1 to cover required debt payments with healthy companies reporting 1.25:1 or higher.
- Gahala, C. L. (2013). Credit management: Principles and practices (4th ed. revised). Columbia, MD: National Association of Credit Management.
- Fraser, L. M., & Ormiston, A. (2010). Understanding financial statements (9th ed.). Upper Saddle River, NJ: Prentice Hall.
- Dean, J. F. (2004). The art & science of financial risk analysis (2nd ed.). Columbia, MD: National Association of Credit Management.
- Supervision and Regulation Division of the Federal Reserve Bank of Atlanta. Director’s guide to credit. Atlanta, GA. Federal Reserve Bank of Atlanta. Print.
- U.S. Securities and Exchange Commission. (2007). Beginners’ guide to financial statements. Retrieved from http://www.sec.gov/investor/pubs/begfinstmtguide.htm
- Jurinski, J. J. (1994). Credit and collections. Barron’s educational series, Hauppauge. New York, NY. Barron’s Business Library.
- Ittelson, T. (1998). Ratio analysis, financial statements, step by step guide to understanding and creating financial reports. Franklin Lakes, NJ: Career Press, Inc.
- Investopedia. (2015). Operating margin. www.investopedia.com
- Accounting Tools. (2015). What is a financial statement review? www.accountingtools.com
- DiCicco Gulman & Company, LLP. (2011). Reviewed financial statements vs. audited. www.dgccpa.com
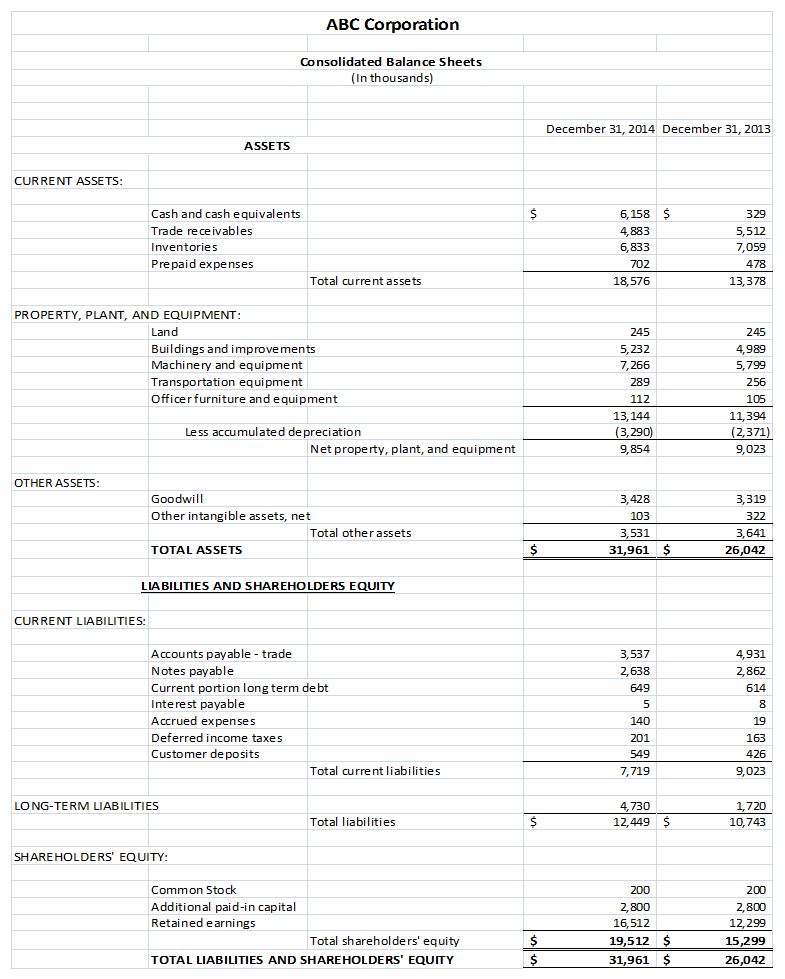
Appendix: Exhibit 1 - ABC Corporation Consolidated Financial Statements

Appendix: Exhibit 2 - XYZ Corporation Consolidated Financial Statements
